Buy Low / Sell High Strategy Optimization
Strategy Overview
This document presents the backtesting results and parameter optimization analysis for the “Buy Low Sell High” trading strategy applied to AAPL stock.
Trading Performance
Interactive Dashboard
Explore the trading history with price movements, individual trades, and performance metrics.
AAPL Trading Performance
Strategy Summary
Best & Worst Trades
This interactive dashboard provides a comprehensive view of our trading strategy’s performance:
- Portfolio Value Line: The blue line tracks our account balance over time, showing the cumulative effect of all trades.
- Individual Trades: Each circle represents a completed trade, with green for profitable trades and red for losses. The size of each circle corresponds to the profit or loss amount.
- Special Highlights: Stars mark our top 5 most profitable trades, while X marks indicate the worst 5 trades.
- Real-time Statistics: Summary metrics and detailed analysis of our best and worst trades are displayed alongside the chart.
The dashboard is fully interactive - use the date range selector to focus on specific periods, hover over any trade for complete details, and click legend items to show or hide specific elements. Zoom functionality allows detailed analysis of any time period of interest.
This trading chart displays the complete performance of the “Buy Low / Sell High” strategy applied to AAPL stock:
- Blue line: Shows the portfolio value growth from initial $100,000 to final $112,885
- Trade markers: Green dots represent profitable trades, red dots represent losing trades, with position indicating return rate
- Special indicators: Yellow stars mark the 5 best trades (up to 15.57% return), purple X marks indicate the 5 worst trades
- Timeline: The slider above the horizontal axis allows selection of specific time periods
- Dual-axis design: Left Y-axis shows portfolio value (USD), right Y-axis shows individual trade returns (percentage)
Interactive features include: hover for trade details, time period filtering, zoom on specific areas, and toggle legend items. The right panel summarizes key strategy metrics and extreme trade records.
Key Technical Indicators
Relative Strength Index (RSI) Calculation
\text{RSI} = 100 - \frac{100}{1 + \frac{\text{Average Gain}}{\text{Average Loss}}}
Where: - Average Gain = Average of all up moves in the look-back period - Average Loss = Average of all down moves in the look-back period
Average True Range (ATR) for Risk Management
\text{ATR} = \frac{1}{n} \sum_{i=1}^{n} \text{TR}_i
\text{TR} = \max((\text{High} - \text{Low}), |(\text{High} - \text{Previous Close})|, |(\text{Low} - \text{Previous Close})|)
Parameter Optimization Results
Optimal Parameter Combination
- RSI Threshold: 35
- ATR Stop Multiplier: 2.0
- ATR Take Multiplier: 5.0
- Optimization Sharpe: 1.42 (sample estimate; not directly comparable to the final back-test Sharpe 0.95)
Dynamic Stop Loss & Take Profit Calculation
\text{Stop Loss} = \text{Entry Price} - \text{ATR} \times \text{Stop Multiplier} \text{Take Profit} = \text{Entry Price} + \text{ATR} \times \text{Take Multiplier}
| Date | Action | Price | Reason | Outcome | Profit/Loss | Return |
|---|---|---|---|---|---|---|
| 2025-04-16 | Buy | $197.02 | RSI below threshold (41.6) | Loss | -$5.73 | -0.02% |
| 2025-04-14 | Buy | $201.76 | RSI below threshold (45.7) | Win | $53.13 | 0.19% |
| 2025-04-10 | Buy | $186.10 | RSI below threshold (38.3) | Win | $1797.46 | 6.48% |
| 2025-04-08 | Buy | $172.06 | RSI below threshold (20.0) | Win | $4160.32 | 15.57% |
| 2025-04-04 | Buy | $177.21 | RSI below threshold (25.2) | Win | $637.00 | 2.40% |
| 2025-04-02 | Buy | $205.53 | RSI below threshold (49.0) | Loss | -$303.26 | -1.14% |
| 2025-03-31 | Buy | $219.87 | RSI below threshold (46.8) | Win | $400.69 | 1.51% |
| Exit Reason | Trades | Percentage | Win Rate | Average Profit | Total Profit | Average Return |
|---|---|---|---|---|---|---|
| RSI Overbought | 19 | 8.6% | 94.7% | $295.84 | $5,620.91 | 1.2% |
| SMA Breakdown | 106 | 47.7% | 49.1% | $64.34 | $6,820.07 | 0.2% |
| Unknown | 97 | 43.7% | 54.6% | $4.57 | $443.65 | 0.0% |
- Total Trades: 222
- Win Rate: 55.41%
- Average Profit: $58.04
- Average Win: $284.53
- Average Loss: -$223.36
- Profit Factor: 1.58
- Maximum Consecutive Wins: 7
- Maximum Consecutive Losses: 6
- Average Holding Period: 1.5 days
Exit Reason Analysis
- RSI Overbought: 19 trades (8.6%), Win Rate: 94.7%, Average Profit: $295.84, Total Profit: $5,620.91, Average Return: 1.2%
- SMA Breakdown: 106 trades (47.7%), Win Rate: 49.1%, Average Profit: $64.34, Total Profit: $6,820.07, Average Return: 0.2%
- Unknown: 97 trades (43.7%), Win Rate: 54.6%, Average Profit: $4.57, Total Profit: $443.65, Average Return: 0.0%
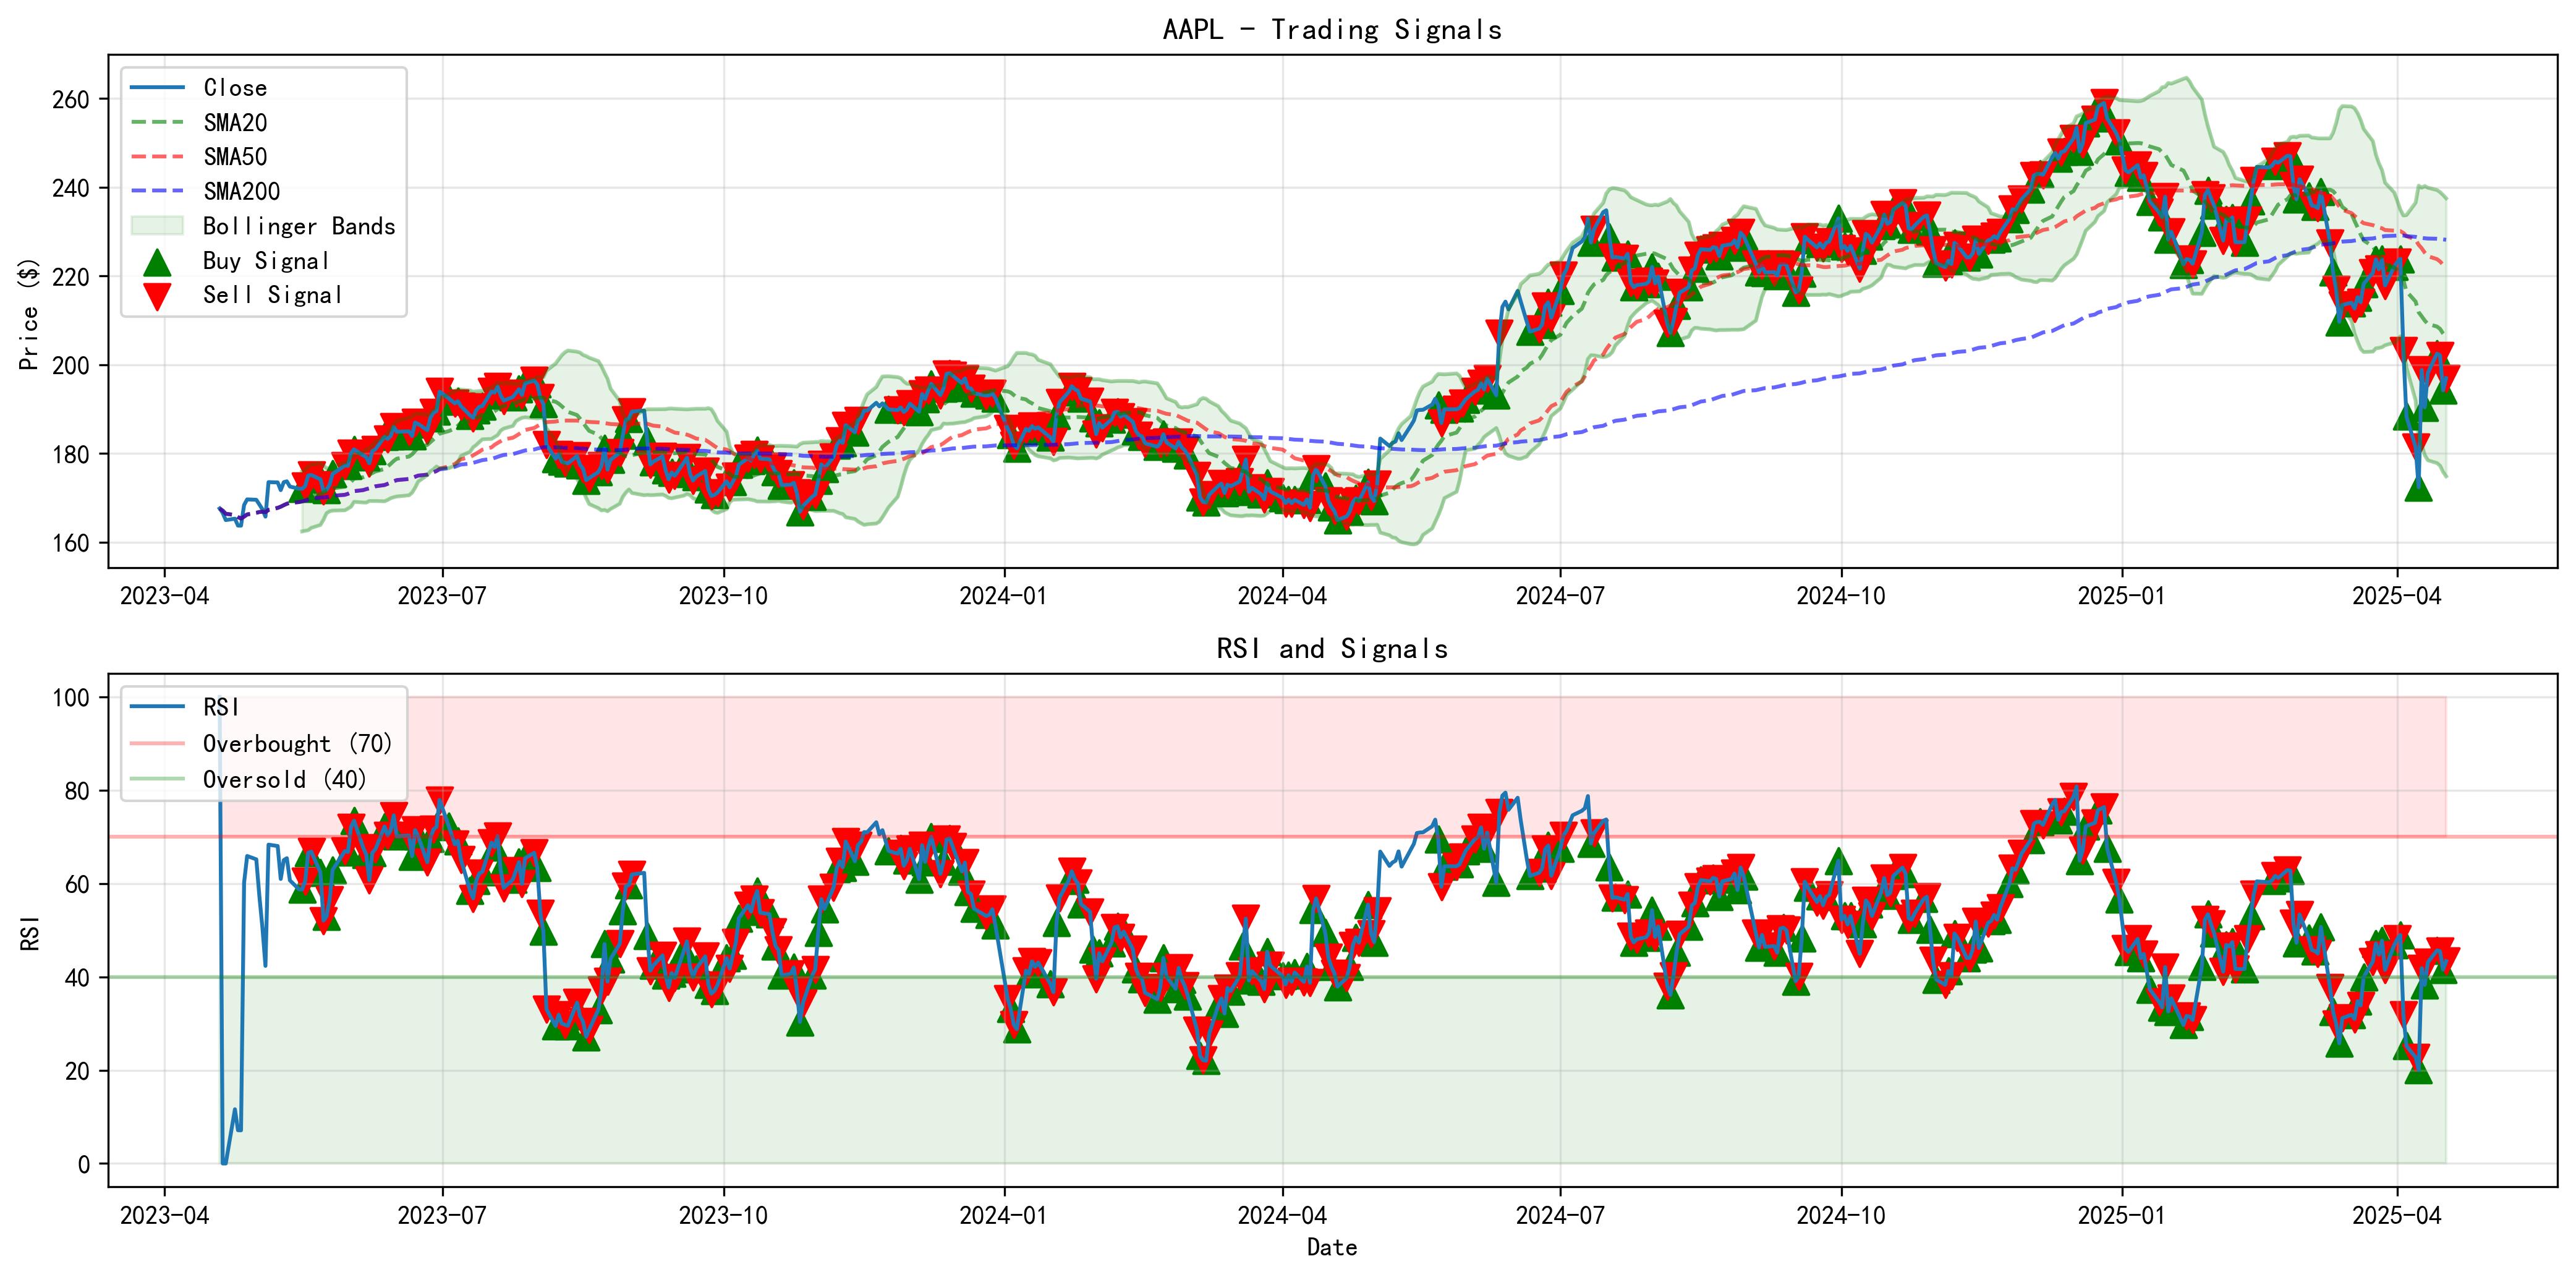
Figure 1: Trading signals with price and RSI indicators. The upper panel shows AAPL price over 24 months with key technical indicators (SMA20, SMA50, SMA200) and Bollinger Bands. Buy signals (green triangles) appear when RSI drops below 35 and price is near support levels. The lower panel shows RSI with clear oversold areas (below 40) and overbought areas (above 70), with frequent trading activity occurring as RSI oscillates between these zones.
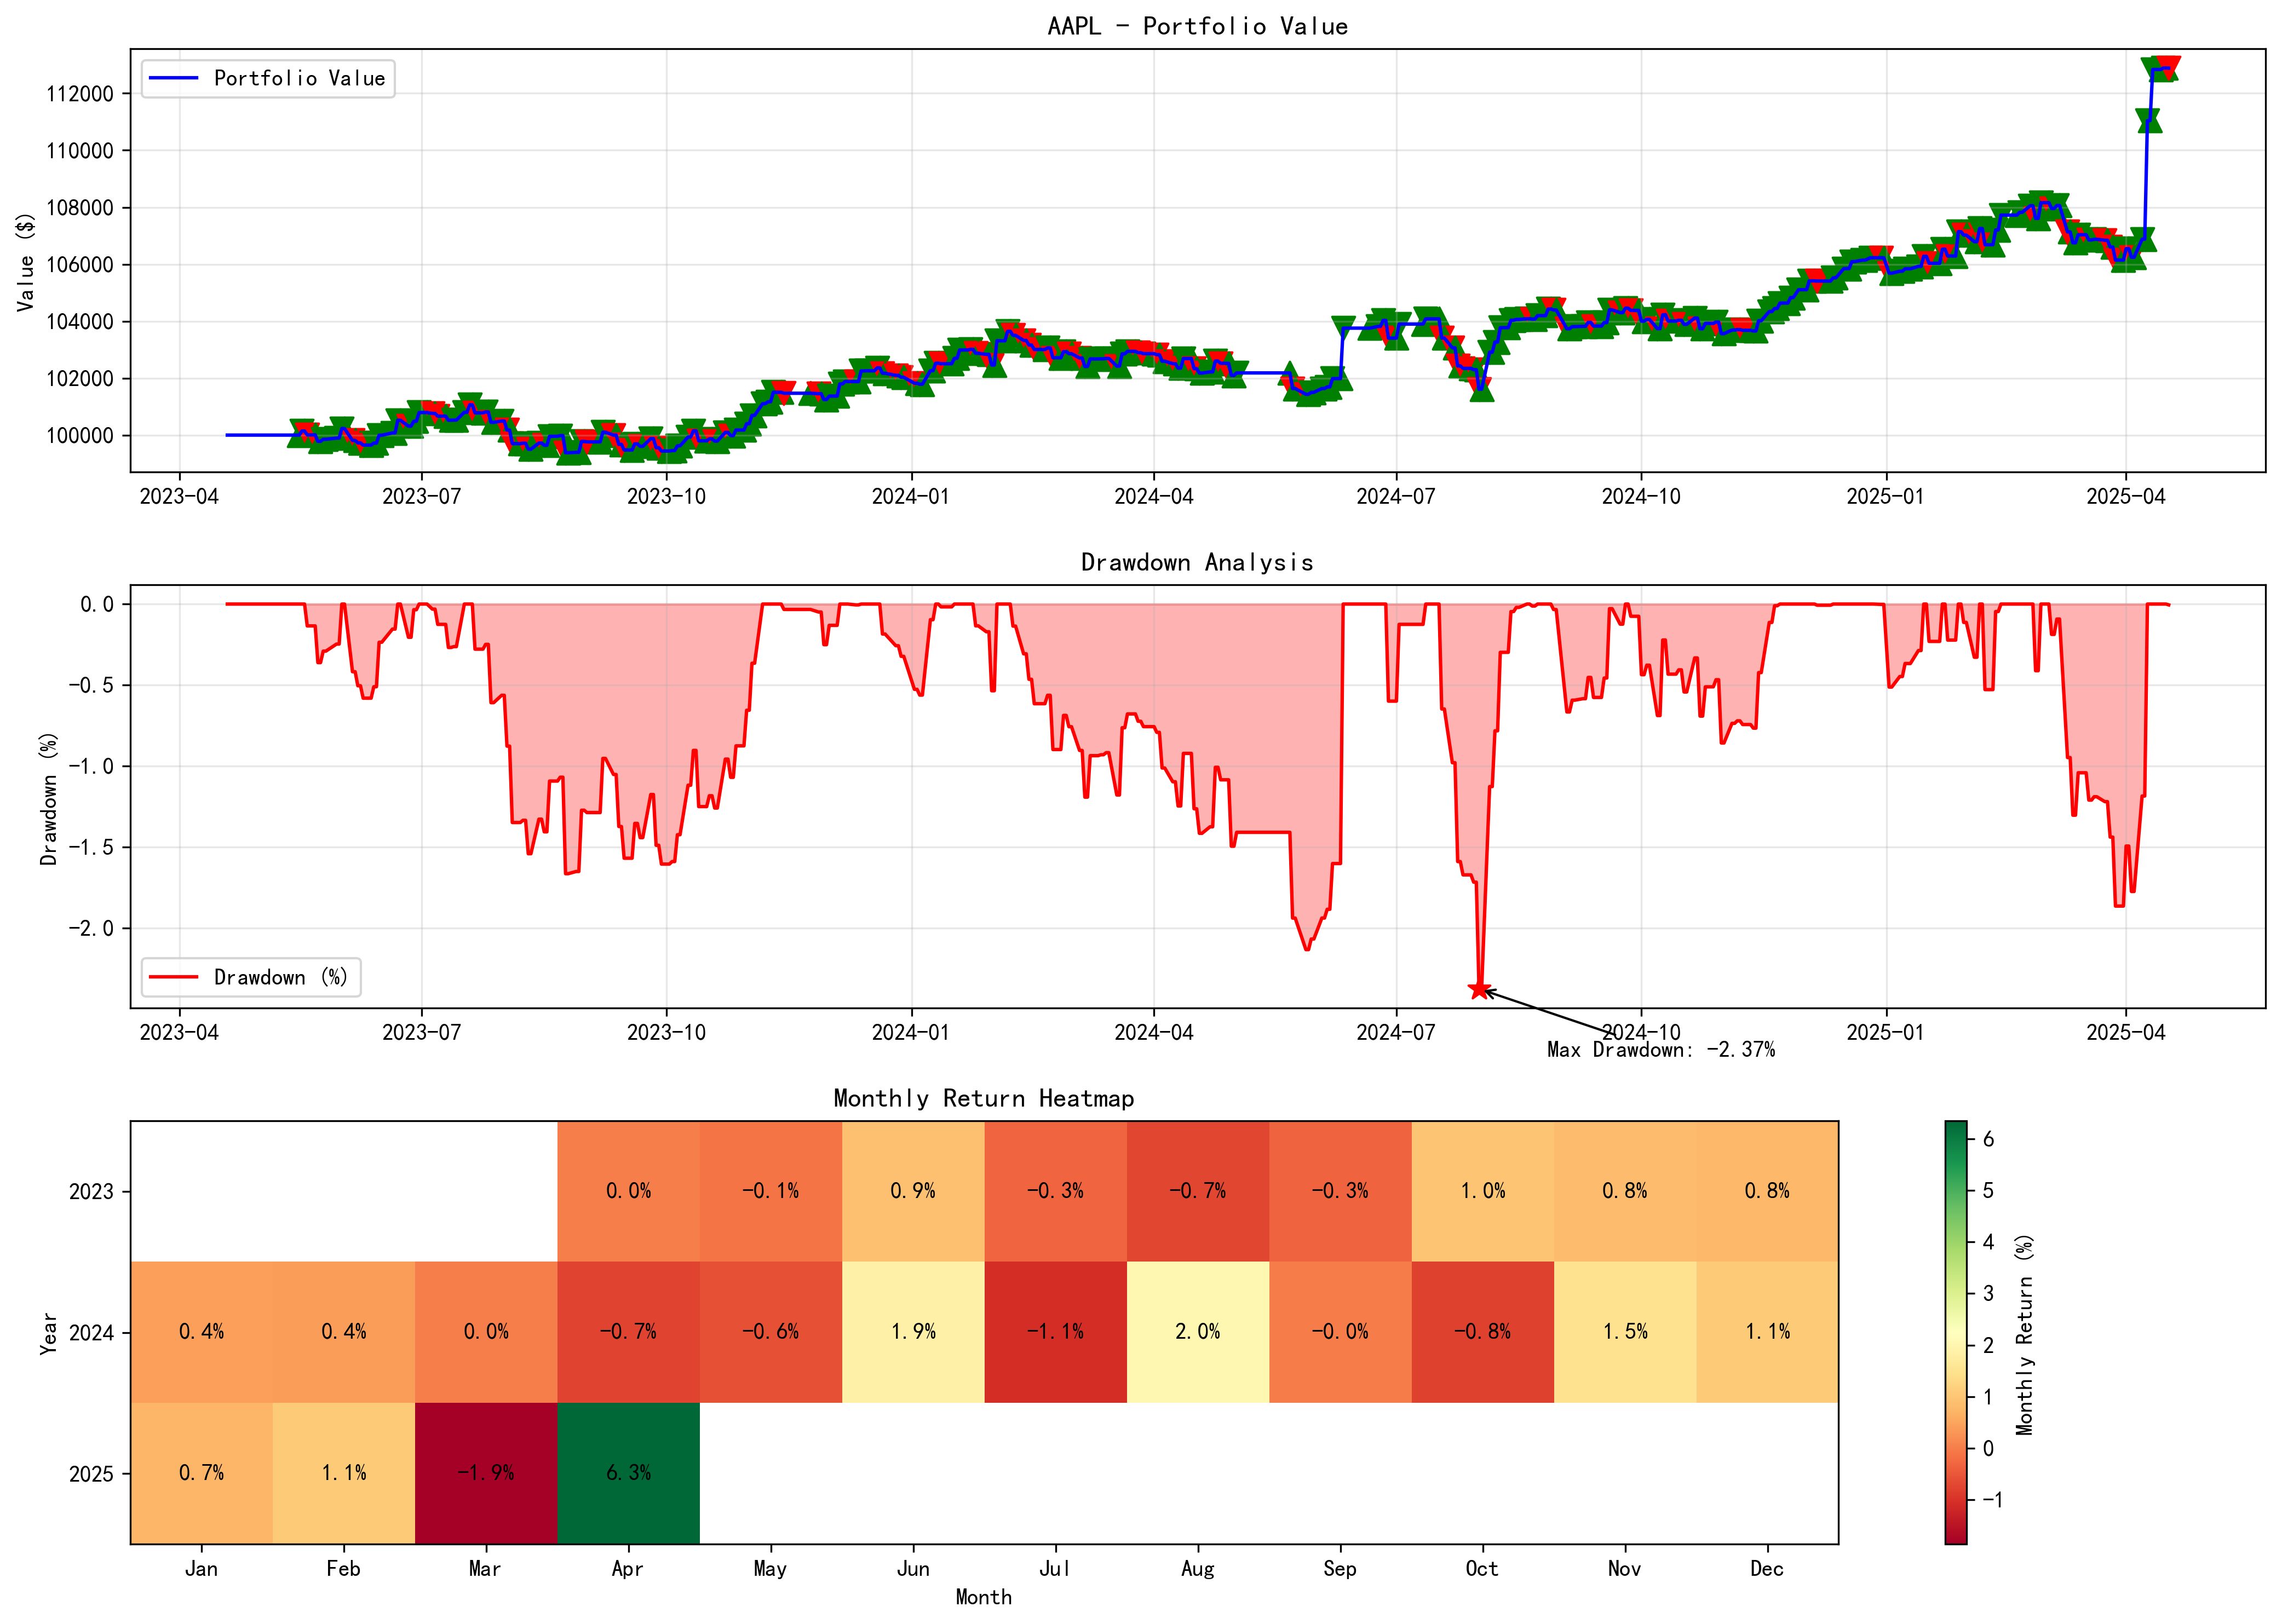
Figure 2: Portfolio value, drawdown and monthly returns. The top panel shows portfolio value growing from $100,000 to $112,885 with green (buy) and red (sell) triangles marking all trades. The middle panel shows drawdowns with a maximum of -2.37% in July 2024, clearly marked with a red star. The bottom panel shows a monthly return heatmap with April 2025 having the highest return (6.3%), consistent with the sharp portfolio value increase visible in the top panel.
Sharpe Ratio - Primary Optimization Metric
\text{Sharpe Ratio} = \frac{R_p - R_f}{\sigma_p}
Where: - R_p = Portfolio’s annualized return - R_f = Risk-free rate of return - \sigma_p = Portfolio’s standard deviation of returns (volatility)
Maximum Drawdown Calculation
\text{Maximum Drawdown} = \min_{\forall t \in (0,T)} \left( \frac{V_t - \max_{s \in (0,t)} V_s}{\max_{s \in (0,t)} V_s} \right)
Where: - V_t = Portfolio value at time t - T = End of evaluation period
Geometric Mean Return
\text{Geometric Mean Return} = \left(\prod_{i=1}^{n}(1 + r_i)\right)^{1/n} - 1
Where: - r_i = Return for period i - n = Number of periods
| Metric | Strategy |
|---|---|
| Initial Capital | $100,000 |
| Final Value | $112,885 |
| Total Return | 12.88% |
| Annualized Return | 6.26% |
| Max Drawdown | 2.37% |
| Geometric Mean Return | 4.28% |
| Alpha | 2.73% |
| Beta | 0.13 |
| Sharpe Ratio | 0.95 |
| Volatility (annualized) | 4.42% |
| Calmar Ratio | 2.64 |
| Win Rate | 55.41% |
| Average Trade Return | 0.26% |
| Average Trades per Year | 111.0 |
=================================================
              PERFORMANCE STATISTICS
=================================================


Backtest Period: 2023-04-19 to 2025-04-17
Total Days: 729 (2.00 years)

Alpha (annualized): 2.73%
Beta: 0.13

Total Return: 12.88%
Annualized Return: 6.26% (arithmetic)
Geometric Mean Annual Return: 4.28%
Volatility (annualized): 4.42%
Sharpe Ratio: 0.95

Total Trades: 222
Average Trades per Year: 111.23
Average Return per Trade: 0.22%
Average Profit per Trade: $58.04
Maximum Drawdown: -2.37%
Calmar Ratio: 2.64
The detailed statistics output from our performance analysis system provides a comprehensive view of the strategy’s behavior:
Alpha & Beta: The strategy shows a positive Alpha (2.73%) and very low Beta (0.13), suggesting strong risk-adjusted outperformance relative to the benchmark with minimal market correlation.
Risk Metrics: With annualized volatility of 4.42% and a Sharpe ratio of 0.95, the strategy demonstrates good risk-adjusted returns.
Geometric Return: The 4.28% geometric mean annual return based on compounding daily returns better represents the actual growth trajectory of the portfolio.
These metrics confirm that while the strategy’s absolute return (12.88%) was modest, its risk-adjusted performance was good, with minimal drawdown and low correlation to market movements.
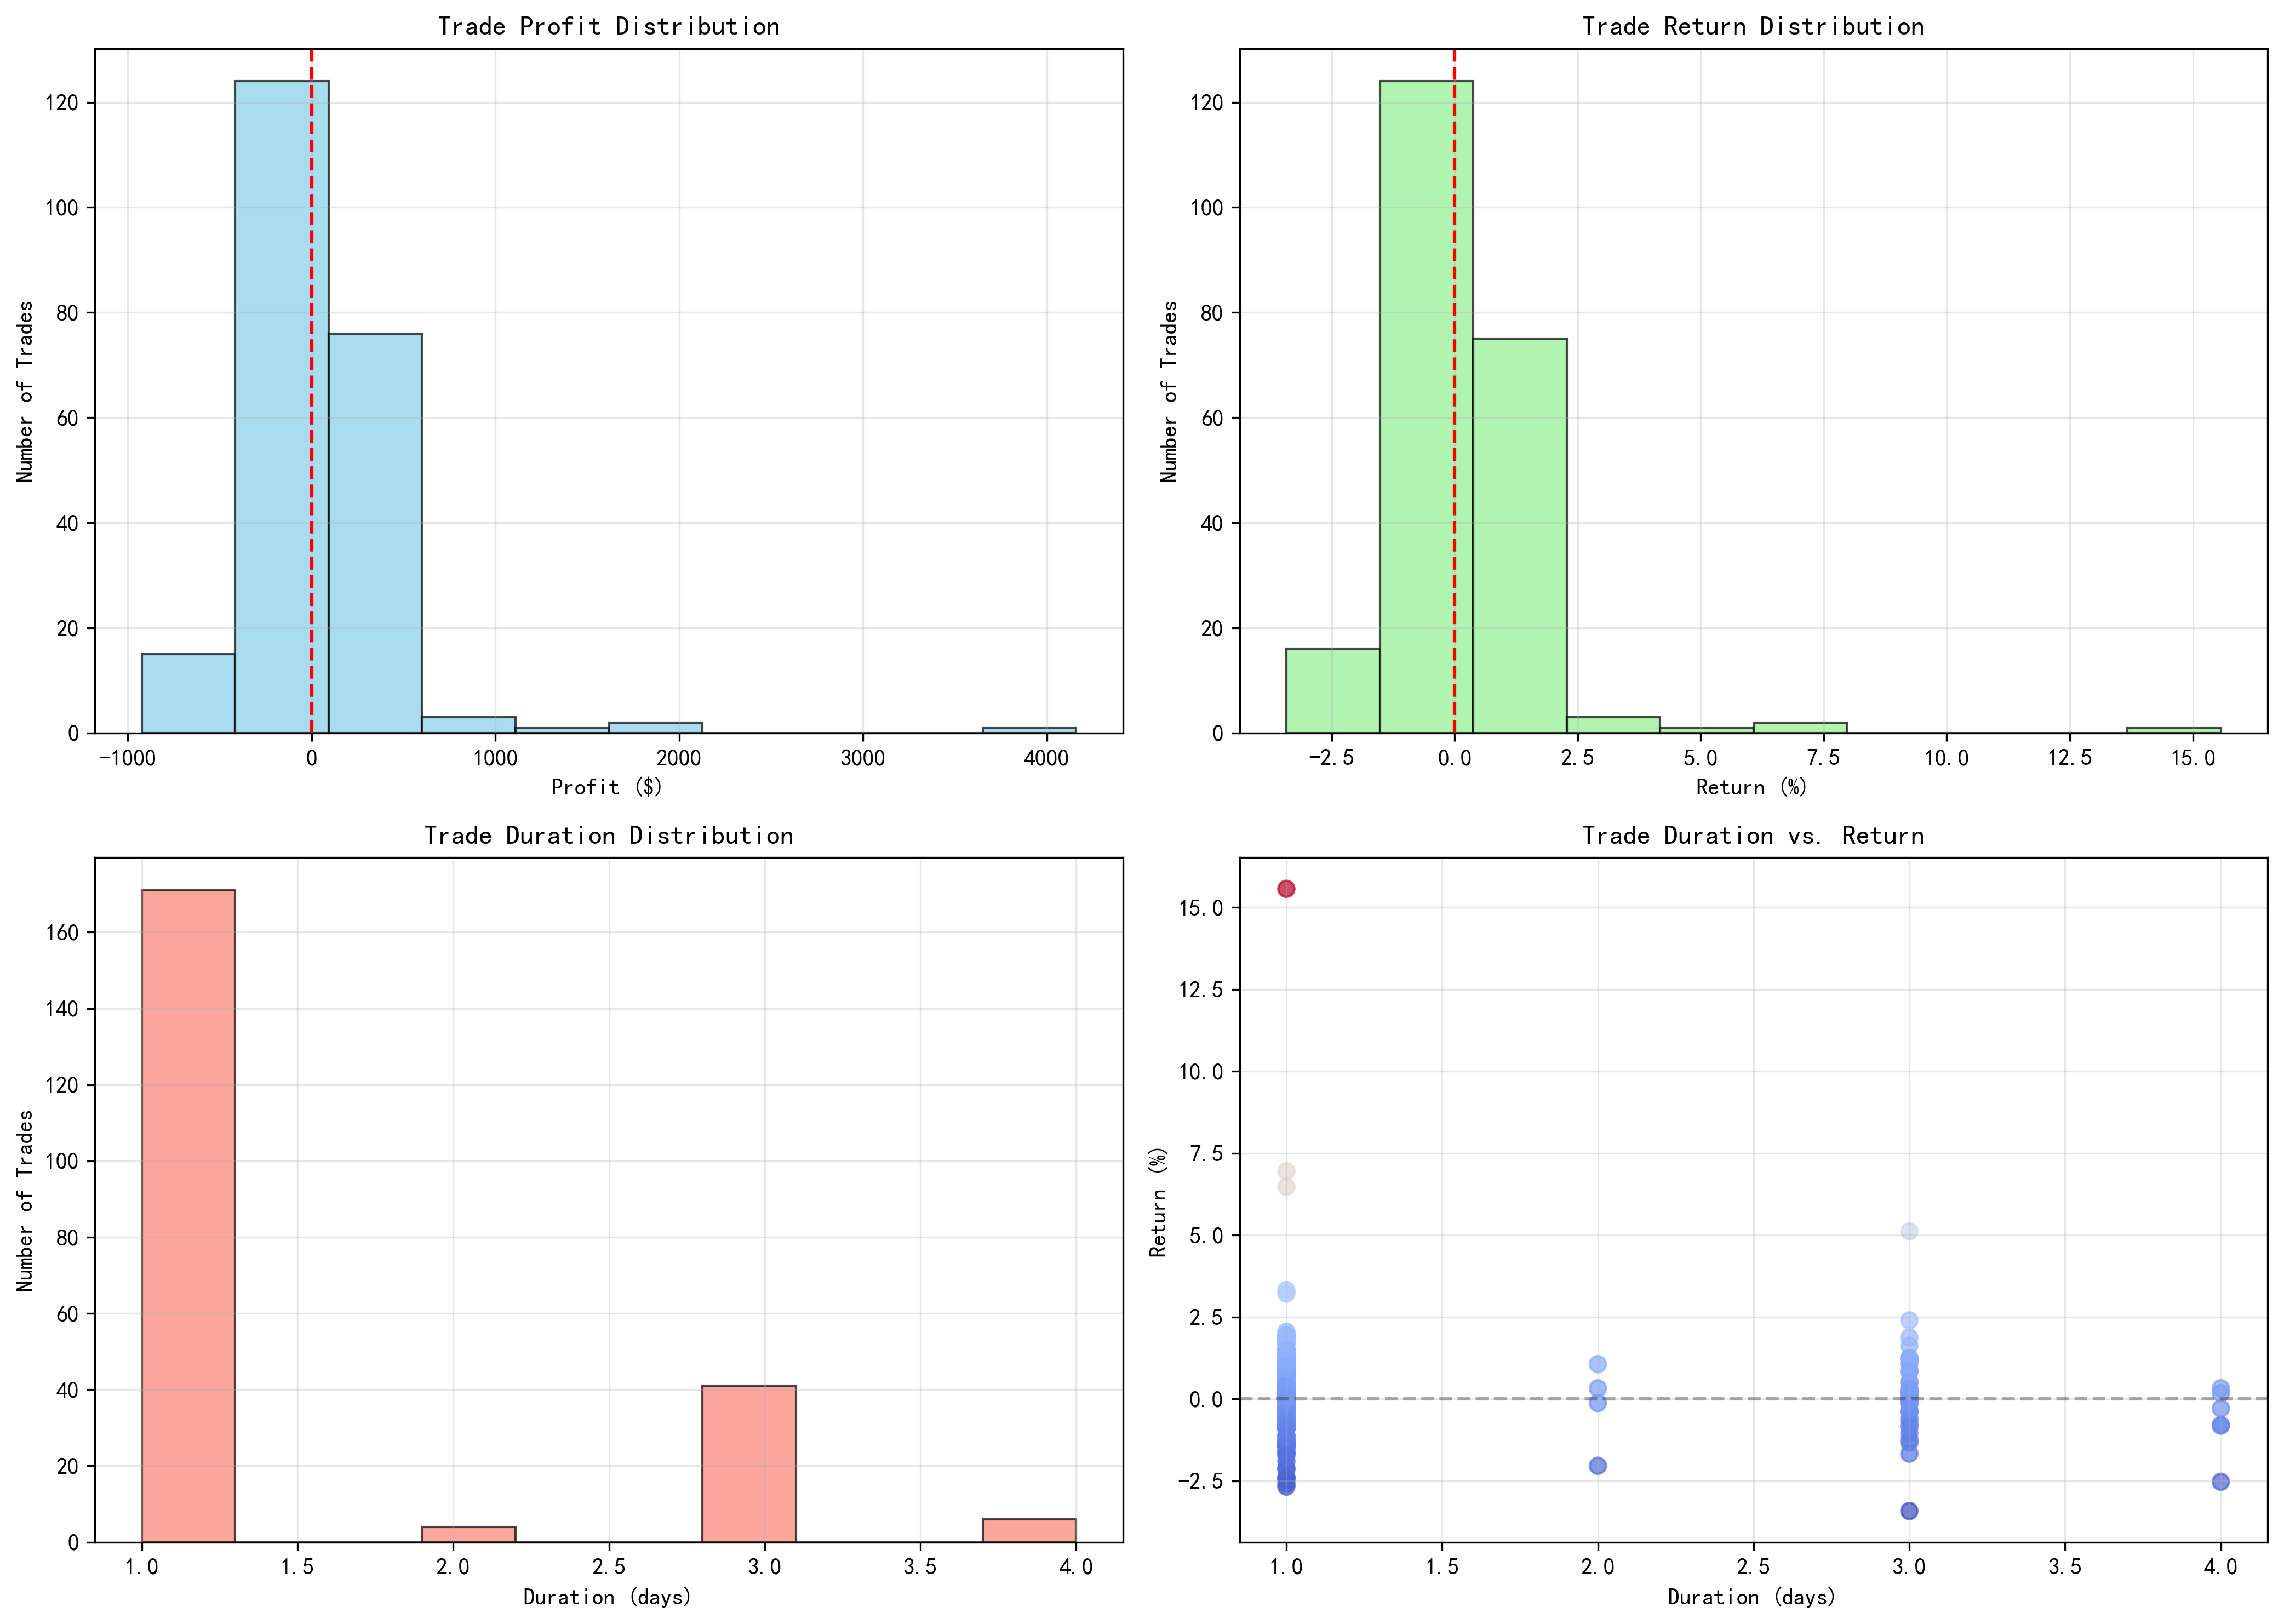
Figure 3: Trade distribution charts. The top-left shows profit distribution with most trades clustered around smaller profits and a few exceptional trades exceeding $2,000-$4,000. The top-right shows percentage returns distribution with a positive skew. The bottom-left histogram reveals the majority of trades had a duration of just 1 day, with smaller clusters at 3 and 4 days. The bottom-right scatter plot shows that the highest returns (including the standout 15% return) occurred on 1-day trades, supporting our quick-exit approach.
Market Context
On April 8, 2025, AAPL stock had been experiencing a significant decline, falling to the $172 range from previous levels above $200. The RSI indicator had fallen to 20, extremely below our threshold of 35, indicating a deeply oversold condition. The price was -5.9% from the lower Bollinger Band, showing exceptional bearish deviation.
Entry and Exit Details
- Entry Date: April 8, 2025
- Entry Price: $172.06
- RSI at Entry: 20
- BB Status: -5.9% from BB Lower
- Stop Loss: $167.46 (ATR × 2.0)
- Take Profit: $189.86 (ATR × 5.0)
- Exit Date: April 9, 2025
- Exit Price: $198.85
- Exit Reason: SMA Breakdown
- Profit/Loss: $4160.32 (15.57% return)
Success Factors
This trade capitalized on a strong bullish reversal after a steep decline. The extremely low RSI (20) indicated a deeply oversold condition, making the entry timing optimal. The price moved rapidly upward the next day, well beyond the take profit target, demonstrating the effectiveness of the strategy in capturing rebounds from oversold levels.
The trade blotter shows all 222 trades over the testing period.
| Entry Date | Exit Date | Days | Entry Price | Exit Price | Shares | Profit/Loss | Return | Exit Reason |
|---|---|---|---|---|---|---|---|---|
| 2023-05-16 | 2023-05-17 | 1 | $171.71 | $172.69 | 145 | $142.68 | 0.57% | Unknown |
| 2023-05-18 | 2023-05-19 | 1 | $176.11 | $175.16 | 142 | -$135.05 | -0.54% | Unknown |
| 2023-05-22 | 2023-05-23 | 1 | $173.13 | $171.56 | 144 | -$226.73 | -0.91% | Unknown |
| 2023-05-24 | 2023-05-25 | 1 | $172.50 | $172.99 | 144 | $70.86 | 0.28% | Unknown |
| 2023-05-26 | 2023-05-30 | 4 | $176.99 | $177.30 | 141 | $43.72 | 0.18% | Unknown |
| 2023-05-31 | 2023-06-01 | 1 | $177.70 | $180.09 | 140 | $335.89 | 1.34% | RSI_Overbought |
| 2023-06-02 | 2023-06-05 | 3 | $182.63 | $179.58 | 137 | -$418.48 | -1.67% | Unknown |
| 2023-06-06 | 2023-06-07 | 1 | $178.44 | $177.82 | 139 | -$86.70 | -0.35% | Unknown |
| 2023-06-08 | 2023-06-09 | 1 | $181.52 | $180.96 | 137 | -$76.92 | -0.31% | Unknown |
| 2023-06-12 | 2023-06-13 | 1 | $182.79 | $183.31 | 136 | $70.87 | 0.28% | RSI_Overbought |
| 2023-06-14 | 2023-06-15 | 1 | $183.98 | $186.01 | 135 | $275.07 | 1.10% | RSI_Overbought |
| 2023-06-16 | 2023-06-20 | 4 | $184.41 | $185.01 | 135 | $81.34 | 0.33% | RSI_Overbought |
| 2023-06-21 | 2023-06-22 | 1 | $183.74 | $187.00 | 136 | $443.90 | 1.77% | RSI_Overbought |
| 2023-06-23 | 2023-06-26 | 3 | $186.80 | $185.27 | 134 | -$205.83 | -0.82% | Unknown |
| 2023-06-27 | 2023-06-28 | 1 | $187.97 | $189.25 | 133 | $170.78 | 0.68% | RSI_Overbought |
| 2023-06-29 | 2023-06-30 | 1 | $191.63 | $193.97 | 131 | $306.76 | 1.22% | RSI_Overbought |
| 2023-07-03 | 2023-07-05 | 2 | $191.57 | $191.33 | 131 | -$31.57 | -0.13% | Unknown |
| 2023-07-06 | 2023-07-07 | 1 | $191.40 | $190.68 | 131 | -$94.76 | -0.38% | Unknown |
| 2023-07-10 | 2023-07-11 | 1 | $189.16 | $188.08 | 133 | -$143.69 | -0.57% | Unknown |
| 2023-07-12 | 2023-07-13 | 1 | $190.50 | $190.54 | 131 | $5.28 | 0.02% | Unknown |
| 2023-07-14 | 2023-07-17 | 3 | $191.90 | $193.99 | 130 | $273.71 | 1.09% | Unknown |
| 2023-07-18 | 2023-07-19 | 1 | $193.10 | $195.10 | 130 | $261.01 | 1.04% | RSI_Overbought |
| 2023-07-20 | 2023-07-21 | 1 | $194.10 | $191.94 | 130 | -$281.16 | -1.11% | Unknown |
| 2023-07-24 | 2023-07-25 | 1 | $193.39 | $193.62 | 130 | $29.96 | 0.12% | Unknown |
| 2023-07-26 | 2023-07-27 | 1 | $196.05 | $193.22 | 128 | -$363.80 | -1.44% | Unknown |
| 2023-07-28 | 2023-07-31 | 3 | $196.09 | $196.45 | 128 | $46.10 | 0.18% | Unknown |
| 2023-08-01 | 2023-08-02 | 1 | $195.04 | $192.58 | 128 | -$316.88 | -1.26% | Unknown |
| 2023-08-03 | 2023-08-04 | 1 | $185.52 | $181.99 | 134 | -$476.53 | -1.90% | SMA_Breakdown |
| 2023-08-07 | 2023-08-08 | 1 | $179.70 | $179.80 | 138 | $13.87 | 0.06% | SMA_Breakdown |
| 2023-08-09 | 2023-08-10 | 1 | $179.47 | $177.97 | 138 | -$208.35 | -0.84% | SMA_Breakdown |
| 2023-08-11 | 2023-08-14 | 3 | $177.92 | $179.46 | 139 | $215.32 | 0.87% | SMA_Breakdown |
| 2023-08-15 | 2023-08-16 | 1 | $177.13 | $176.57 | 140 | -$78.82 | -0.32% | SMA_Breakdown |
| 2023-08-17 | 2023-08-18 | 1 | $172.30 | $174.49 | 144 | $316.62 | 1.27% | SMA_Breakdown |
| 2023-08-21 | 2023-08-22 | 1 | $177.06 | $177.23 | 141 | $23.99 | 0.10% | SMA_Breakdown |
| 2023-08-23 | 2023-08-24 | 1 | $180.73 | $176.38 | 138 | -$601.62 | -2.41% | SMA_Breakdown |
| 2023-08-25 | 2023-08-28 | 3 | $180.09 | $180.19 | 137 | $13.80 | 0.06% | SMA_Breakdown |
| 2023-08-29 | 2023-08-30 | 1 | $184.81 | $187.65 | 134 | $381.85 | 1.54% | Unknown |
| 2023-08-31 | 2023-09-01 | 1 | $189.57 | $189.46 | 131 | -$14.47 | -0.06% | Unknown |
| 2023-09-06 | 2023-09-07 | 1 | $175.19 | $177.56 | 142 | $337.40 | 1.35% | SMA_Breakdown |
| 2023-09-08 | 2023-09-11 | 3 | $180.08 | $179.36 | 138 | -$100.05 | -0.40% | SMA_Breakdown |
| 2023-09-12 | 2023-09-13 | 1 | $176.50 | $174.21 | 141 | -$324.36 | -1.30% | SMA_Breakdown |
| 2023-09-14 | 2023-09-15 | 1 | $176.41 | $175.01 | 141 | -$197.76 | -0.79% | SMA_Breakdown |
| 2023-09-18 | 2023-09-19 | 1 | $177.52 | $179.07 | 140 | $217.14 | 0.87% | SMA_Breakdown |
| 2023-09-20 | 2023-09-21 | 1 | $174.55 | $173.93 | 142 | -$88.53 | -0.36% | SMA_Breakdown |
| 2023-09-22 | 2023-09-25 | 3 | $174.20 | $176.08 | 142 | $268.74 | 1.08% | SMA_Breakdown |
| 2023-09-26 | 2023-09-27 | 1 | $172.62 | $170.43 | 144 | -$316.77 | -1.27% | SMA_Breakdown |
| 2023-09-28 | 2023-09-29 | 1 | $172.02 | $171.21 | 144 | -$117.20 | -0.47% | SMA_Breakdown |
| 2023-10-02 | 2023-10-03 | 1 | $172.29 | $172.40 | 144 | $15.87 | 0.06% | SMA_Breakdown |
| 2023-10-04 | 2023-10-05 | 1 | $173.74 | $174.91 | 143 | $167.44 | 0.67% | SMA_Breakdown |
| 2023-10-06 | 2023-10-09 | 3 | $176.80 | $178.99 | 140 | $308.51 | 1.24% | SMA_Breakdown |
| 2023-10-10 | 2023-10-11 | 1 | $178.25 | $179.80 | 140 | $217.24 | 0.87% | Unknown |
| 2023-10-12 | 2023-10-13 | 1 | $181.39 | $178.85 | 138 | -$350.60 | -1.40% | Unknown |
| 2023-10-16 | 2023-10-17 | 1 | $176.67 | $177.15 | 141 | $67.79 | 0.27% | SMA_Breakdown |
| 2023-10-18 | 2023-10-19 | 1 | $176.00 | $175.46 | 141 | -$76.60 | -0.31% | SMA_Breakdown |
| 2023-10-20 | 2023-10-23 | 3 | $170.91 | $173.00 | 145 | $305.08 | 1.22% | SMA_Breakdown |
| 2023-10-24 | 2023-10-25 | 1 | $171.88 | $171.10 | 145 | -$113.56 | -0.45% | SMA_Breakdown |
| 2023-10-26 | 2023-10-27 | 1 | $166.91 | $168.22 | 149 | $196.18 | 0.78% | SMA_Breakdown |
| 2023-10-30 | 2023-10-31 | 1 | $169.27 | $170.77 | 147 | $221.93 | 0.89% | SMA_Breakdown |
| 2023-11-01 | 2023-11-02 | 1 | $175.52 | $177.57 | 143 | $293.16 | 1.17% | Unknown |
| 2023-11-03 | 2023-11-06 | 3 | $176.36 | $179.23 | 142 | $409.66 | 1.63% | Unknown |
| 2023-11-07 | 2023-11-08 | 1 | $182.41 | $182.89 | 138 | $66.51 | 0.26% | Unknown |
| 2023-11-09 | 2023-11-10 | 1 | $183.97 | $186.40 | 137 | $334.08 | 1.32% | Unknown |
| 2023-11-13 | 2023-11-14 | 1 | $187.69 | $187.44 | 135 | -$33.80 | -0.13% | Unknown |
| 2023-11-24 | 2023-11-27 | 3 | $189.91 | $189.79 | 133 | -$16.03 | -0.06% | Unknown |
| 2023-11-28 | 2023-11-29 | 1 | $190.91 | $189.37 | 132 | -$204.60 | -0.81% | Unknown |
| 2023-11-30 | 2023-12-01 | 1 | $190.33 | $191.24 | 132 | $121.02 | 0.48% | Unknown |
| 2023-12-04 | 2023-12-05 | 1 | $190.21 | $193.42 | 133 | $427.68 | 1.69% | Unknown |
| 2023-12-06 | 2023-12-07 | 1 | $193.63 | $194.27 | 131 | $84.12 | 0.33% | Unknown |
| 2023-12-08 | 2023-12-11 | 3 | $193.22 | $193.18 | 131 | -$5.27 | -0.02% | Unknown |
| 2023-12-12 | 2023-12-13 | 1 | $195.08 | $197.96 | 130 | $376.00 | 1.48% | Unknown |
| 2023-12-14 | 2023-12-15 | 1 | $197.53 | $197.57 | 129 | $5.18 | 0.02% | Unknown |
| 2023-12-18 | 2023-12-19 | 1 | $196.15 | $196.94 | 130 | $102.96 | 0.40% | Unknown |
| 2023-12-20 | 2023-12-21 | 1 | $196.13 | $194.68 | 130 | -$189.19 | -0.74% | Unknown |
| 2023-12-22 | 2023-12-26 | 4 | $193.61 | $193.05 | 131 | -$73.88 | -0.29% | Unknown |
| 2023-12-27 | 2023-12-28 | 1 | $194.09 | $193.58 | 131 | -$67.07 | -0.26% | Unknown |
| 2023-12-29 | 2024-01-02 | 4 | $187.17 | $185.64 | 136 | -$208.51 | -0.82% | SMA_Breakdown |
| 2024-01-03 | 2024-01-04 | 1 | $182.17 | $181.91 | 139 | -$36.33 | -0.14% | SMA_Breakdown |
| 2024-01-05 | 2024-01-08 | 3 | $182.15 | $185.56 | 139 | $476.38 | 1.87% | SMA_Breakdown |
| 2024-01-09 | 2024-01-10 | 1 | $184.31 | $186.19 | 138 | $260.77 | 1.02% | SMA_Breakdown |
| 2024-01-11 | 2024-01-12 | 1 | $186.05 | $185.92 | 137 | -$17.91 | -0.07% | SMA_Breakdown |
| 2024-01-16 | 2024-01-17 | 1 | $181.33 | $182.68 | 141 | $190.79 | 0.74% | SMA_Breakdown |
| 2024-01-18 | 2024-01-19 | 1 | $189.40 | $191.56 | 135 | $292.80 | 1.14% | Unknown |
| 2024-01-22 | 2024-01-23 | 1 | $195.01 | $195.18 | 132 | $22.45 | 0.09% | Unknown |
| 2024-01-24 | 2024-01-25 | 1 | $195.22 | $194.17 | 131 | -$138.51 | -0.54% | Unknown |
| 2024-01-26 | 2024-01-29 | 3 | $192.01 | $191.73 | 133 | -$37.50 | -0.15% | Unknown |
| 2024-01-30 | 2024-01-31 | 1 | $187.13 | $184.40 | 137 | -$375.06 | -1.46% | SMA_Breakdown |
| 2024-02-01 | 2024-02-02 | 1 | $179.87 | $185.85 | 142 | $851.60 | 3.32% | SMA_Breakdown |
| 2024-02-05 | 2024-02-06 | 1 | $186.90 | $189.30 | 138 | $331.66 | 1.28% | SMA_Breakdown |
| 2024-02-07 | 2024-02-08 | 1 | $189.35 | $188.32 | 136 | -$140.95 | -0.54% | SMA_Breakdown |
| 2024-02-09 | 2024-02-12 | 3 | $188.44 | $187.15 | 137 | -$177.14 | -0.68% | SMA_Breakdown |
| 2024-02-13 | 2024-02-14 | 1 | $185.32 | $184.15 | 139 | -$163.08 | -0.63% | SMA_Breakdown |
| 2024-02-15 | 2024-02-16 | 1 | $183.42 | $182.31 | 140 | -$156.08 | -0.61% | SMA_Breakdown |
| 2024-02-20 | 2024-02-21 | 1 | $181.94 | $182.32 | 141 | $53.78 | 0.21% | SMA_Breakdown |
| 2024-02-22 | 2024-02-23 | 1 | $185.01 | $182.52 | 139 | -$346.76 | -1.35% | SMA_Breakdown |
| 2024-02-26 | 2024-02-27 | 1 | $181.09 | $182.63 | 141 | $218.37 | 0.85% | SMA_Breakdown |
| 2024-02-28 | 2024-02-29 | 1 | $181.26 | $180.75 | 141 | -$72.40 | -0.28% | SMA_Breakdown |
| 2024-03-01 | 2024-03-04 | 3 | $176.14 | $175.10 | 145 | -$151.83 | -0.59% | SMA_Breakdown |
| 2024-03-05 | 2024-03-06 | 1 | $171.11 | $169.12 | 150 | -$298.62 | -1.16% | SMA_Breakdown |
| 2024-03-07 | 2024-03-08 | 1 | $168.98 | $170.73 | 151 | $265.14 | 1.04% | SMA_Breakdown |
| 2024-03-11 | 2024-03-12 | 1 | $173.19 | $173.23 | 148 | $5.93 | 0.02% | SMA_Breakdown |
| 2024-03-13 | 2024-03-14 | 1 | $172.91 | $173.00 | 148 | $13.36 | 0.05% | SMA_Breakdown |
| 2024-03-15 | 2024-03-18 | 3 | $175.57 | $173.72 | 146 | -$270.52 | -1.05% | SMA_Breakdown |
| 2024-03-19 | 2024-03-20 | 1 | $175.72 | $178.67 | 145 | $429.87 | 1.68% | SMA_Breakdown |
| 2024-03-21 | 2024-03-22 | 1 | $171.69 | $172.28 | 149 | $88.36 | 0.34% | SMA_Breakdown |
| 2024-03-25 | 2024-03-26 | 1 | $170.02 | $169.71 | 151 | -$46.92 | -0.18% | SMA_Breakdown |
| 2024-03-27 | 2024-03-28 | 1 | $171.71 | $171.48 | 149 | -$34.46 | -0.13% | SMA_Breakdown |
| 2024-04-01 | 2024-04-02 | 1 | $169.08 | $168.84 | 152 | -$36.50 | -0.14% | SMA_Breakdown |
| 2024-04-03 | 2024-04-04 | 1 | $170.33 | $168.82 | 150 | -$227.88 | -0.89% | SMA_Breakdown |
| 2024-04-05 | 2024-04-08 | 3 | $169.03 | $168.45 | 151 | -$88.01 | -0.34% | SMA_Breakdown |
| 2024-04-09 | 2024-04-10 | 1 | $168.80 | $167.78 | 151 | -$154.85 | -0.60% | SMA_Breakdown |
| 2024-04-11 | 2024-04-12 | 1 | $174.26 | $176.55 | 146 | $336.26 | 1.31% | SMA_Breakdown |
| 2024-04-15 | 2024-04-16 | 1 | $171.75 | $169.38 | 149 | -$354.25 | -1.38% | SMA_Breakdown |
| 2024-04-17 | 2024-04-18 | 1 | $168.07 | $167.04 | 152 | -$156.79 | -0.61% | SMA_Breakdown |
| 2024-04-19 | 2024-04-22 | 3 | $165.57 | $165.84 | 154 | $41.66 | 0.16% | SMA_Breakdown |
| 2024-04-23 | 2024-04-24 | 1 | $166.54 | $169.02 | 153 | $380.54 | 1.49% | SMA_Breakdown |
| 2024-04-25 | 2024-04-26 | 1 | $169.83 | $169.30 | 151 | -$80.05 | -0.31% | SMA_Breakdown |
| 2024-04-29 | 2024-04-30 | 1 | $173.20 | $170.33 | 147 | -$424.70 | -1.66% | SMA_Breakdown |
| 2024-05-01 | 2024-05-02 | 1 | $172.43 | $173.03 | 148 | $88.81 | 0.35% | Unknown |
| 2024-05-22 | 2024-05-23 | 1 | $190.98 | $186.88 | 133 | -$548.42 | -2.15% | Unknown |
| 2024-05-24 | 2024-05-28 | 4 | $191.51 | $189.99 | 132 | -$201.67 | -0.79% | Unknown |
| 2024-05-29 | 2024-05-30 | 1 | $190.78 | $191.29 | 132 | $67.79 | 0.27% | Unknown |
| 2024-05-31 | 2024-06-03 | 3 | $193.01 | $194.03 | 131 | $134.10 | 0.53% | Unknown |
| 2024-06-04 | 2024-06-05 | 1 | $195.44 | $195.87 | 130 | $55.90 | 0.22% | RSI_Overbought |
| 2024-06-06 | 2024-06-07 | 1 | $194.65 | $196.89 | 130 | $292.56 | 1.15% | RSI_Overbought |
| 2024-06-10 | 2024-06-11 | 1 | $193.69 | $207.15 | 131 | $1771.77 | 6.95% | RSI_Overbought |
| 2024-06-21 | 2024-06-24 | 3 | $207.67 | $208.14 | 124 | $58.70 | 0.23% | Unknown |
| 2024-06-25 | 2024-06-26 | 1 | $211.50 | $213.25 | 122 | $214.75 | 0.83% | Unknown |
| 2024-06-27 | 2024-06-28 | 1 | $215.79 | $210.62 | 120 | -$623.09 | -2.40% | Unknown |
| 2024-07-01 | 2024-07-02 | 1 | $216.15 | $220.27 | 119 | $492.75 | 1.91% | RSI_Overbought |
| 2024-07-11 | 2024-07-12 | 1 | $228.92 | $230.54 | 113 | $183.81 | 0.71% | RSI_Overbought |
| 2024-07-17 | 2024-07-18 | 1 | $230.14 | $224.18 | 113 | -$673.86 | -2.59% | Unknown |
| 2024-07-19 | 2024-07-22 | 3 | $226.99 | $223.96 | 113 | -$345.09 | -1.33% | Unknown |
| 2024-07-23 | 2024-07-24 | 1 | $224.06 | $218.54 | 114 | -$634.77 | -2.46% | Unknown |
| 2024-07-25 | 2024-07-26 | 1 | $218.69 | $217.96 | 117 | -$85.48 | -0.33% | Unknown |
| 2024-07-29 | 2024-07-30 | 1 | $219.20 | $218.80 | 116 | -$46.69 | -0.18% | Unknown |
| 2024-07-31 | 2024-08-01 | 1 | $224.37 | $218.36 | 113 | -$685.03 | -2.68% | Unknown |
| 2024-08-02 | 2024-08-05 | 3 | $199.09 | $209.27 | 127 | $1298.92 | 5.11% | SMA_Breakdown |
| 2024-08-06 | 2024-08-07 | 1 | $206.94 | $209.82 | 124 | $358.05 | 1.39% | SMA_Breakdown |
| 2024-08-08 | 2024-08-09 | 1 | $212.10 | $216.24 | 121 | $503.93 | 1.95% | Unknown |
| 2024-08-12 | 2024-08-13 | 1 | $219.06 | $221.27 | 118 | $261.73 | 1.01% | Unknown |
| 2024-08-14 | 2024-08-15 | 1 | $224.49 | $224.72 | 115 | $26.65 | 0.10% | Unknown |
| 2024-08-16 | 2024-08-19 | 3 | $225.67 | $225.89 | 115 | $25.36 | 0.10% | Unknown |
| 2024-08-20 | 2024-08-21 | 1 | $226.51 | $226.40 | 114 | -$12.64 | -0.05% | Unknown |
| 2024-08-22 | 2024-08-23 | 1 | $225.79 | $226.84 | 115 | $120.99 | 0.47% | Unknown |
| 2024-08-26 | 2024-08-27 | 1 | $226.00 | $228.03 | 115 | $233.98 | 0.90% | Unknown |
| 2024-08-28 | 2024-08-29 | 1 | $230.10 | $229.79 | 113 | -$35.17 | -0.13% | Unknown |
| 2024-08-30 | 2024-09-03 | 4 | $228.55 | $222.77 | 114 | -$660.02 | -2.53% | Unknown |
| 2024-09-04 | 2024-09-05 | 1 | $221.73 | $222.38 | 116 | $76.02 | 0.29% | SMA_Breakdown |
| 2024-09-06 | 2024-09-09 | 3 | $220.83 | $220.91 | 117 | $9.40 | 0.04% | SMA_Breakdown |
| 2024-09-10 | 2024-09-11 | 1 | $221.49 | $222.66 | 117 | $137.10 | 0.53% | SMA_Breakdown |
| 2024-09-12 | 2024-09-13 | 1 | $223.61 | $222.50 | 116 | -$129.01 | -0.50% | SMA_Breakdown |
| 2024-09-16 | 2024-09-17 | 1 | $215.75 | $216.79 | 120 | $125.12 | 0.48% | SMA_Breakdown |
| 2024-09-18 | 2024-09-19 | 1 | $225.00 | $228.87 | 115 | $446.99 | 1.72% | Unknown |
| 2024-09-20 | 2024-09-23 | 3 | $227.34 | $226.47 | 114 | -$99.88 | -0.38% | Unknown |
| 2024-09-24 | 2024-09-25 | 1 | $225.01 | $226.37 | 115 | $157.60 | 0.60% | Unknown |
| 2024-09-26 | 2024-09-27 | 1 | $228.48 | $227.79 | 114 | -$78.86 | -0.30% | Unknown |
| 2024-09-30 | 2024-10-01 | 1 | $229.52 | $226.21 | 113 | -$376.32 | -1.44% | Unknown |
| 2024-10-02 | 2024-10-03 | 1 | $225.14 | $225.67 | 115 | $61.21 | 0.24% | Unknown |
| 2024-10-04 | 2024-10-07 | 3 | $224.49 | $221.69 | 115 | -$324.49 | -1.25% | SMA_Breakdown |
| 2024-10-08 | 2024-10-09 | 1 | $225.31 | $229.54 | 115 | $486.90 | 1.88% | Unknown |
| 2024-10-10 | 2024-10-11 | 1 | $229.49 | $227.55 | 113 | -$220.27 | -0.85% | Unknown |
| 2024-10-14 | 2024-10-15 | 1 | $233.60 | $233.85 | 111 | $27.83 | 0.11% | Unknown |
| 2024-10-16 | 2024-10-17 | 1 | $233.43 | $232.15 | 111 | -$142.61 | -0.55% | Unknown |
| 2024-10-18 | 2024-10-21 | 3 | $234.50 | $236.48 | 110 | $219.30 | 0.84% | Unknown |
| 2024-10-22 | 2024-10-23 | 1 | $234.13 | $230.76 | 111 | -$374.63 | -1.44% | Unknown |
| 2024-10-24 | 2024-10-25 | 1 | $229.74 | $231.41 | 112 | $188.51 | 0.73% | Unknown |
| 2024-10-28 | 2024-10-29 | 1 | $233.26 | $233.67 | 111 | $45.67 | 0.18% | Unknown |
| 2024-10-30 | 2024-10-31 | 1 | $229.51 | $225.91 | 113 | -$407.70 | -1.57% | SMA_Breakdown |
| 2024-11-01 | 2024-11-04 | 3 | $220.93 | $222.01 | 117 | $126.56 | 0.49% | SMA_Breakdown |
| 2024-11-05 | 2024-11-06 | 1 | $222.58 | $222.72 | 116 | $16.30 | 0.06% | SMA_Breakdown |
| 2024-11-07 | 2024-11-08 | 1 | $227.17 | $226.96 | 114 | -$23.97 | -0.09% | Unknown |
| 2024-11-11 | 2024-11-12 | 1 | $224.43 | $224.23 | 115 | -$23.10 | -0.09% | SMA_Breakdown |
| 2024-11-13 | 2024-11-14 | 1 | $225.11 | $228.22 | 115 | $358.02 | 1.38% | Unknown |
| 2024-11-15 | 2024-11-18 | 3 | $225.22 | $228.02 | 115 | $323.29 | 1.24% | Unknown |
| 2024-11-19 | 2024-11-20 | 1 | $228.06 | $229.00 | 114 | $107.51 | 0.41% | Unknown |
| 2024-11-21 | 2024-11-22 | 1 | $228.21 | $229.87 | 114 | $189.93 | 0.73% | Unknown |
| 2024-11-25 | 2024-11-26 | 1 | $233.35 | $235.06 | 112 | $191.69 | 0.73% | Unknown |
| 2024-11-27 | 2024-11-29 | 2 | $234.84 | $237.33 | 111 | $277.87 | 1.06% | Unknown |
| 2024-12-02 | 2024-12-03 | 1 | $239.82 | $242.65 | 109 | $310.07 | 1.18% | RSI_Overbought |
| 2024-12-05 | 2024-12-06 | 1 | $242.91 | $242.84 | 108 | -$7.59 | -0.03% | RSI_Overbought |
| 2024-12-11 | 2024-12-12 | 1 | $246.89 | $247.96 | 106 | $114.21 | 0.43% | RSI_Overbought |
| 2024-12-13 | 2024-12-16 | 3 | $247.99 | $251.04 | 106 | $324.45 | 1.23% | RSI_Overbought |
| 2024-12-18 | 2024-12-19 | 1 | $247.50 | $249.79 | 106 | $244.84 | 0.93% | Unknown |
| 2024-12-20 | 2024-12-23 | 3 | $254.77 | $255.27 | 104 | $52.05 | 0.20% | RSI_Overbought |
| 2024-12-24 | 2024-12-26 | 2 | $258.19 | $259.02 | 102 | $85.30 | 0.32% | RSI_Overbought |
| 2024-12-27 | 2024-12-30 | 3 | $252.22 | $252.20 | 105 | -$2.11 | -0.01% | Unknown |
| 2024-12-31 | 2025-01-02 | 2 | $248.93 | $243.85 | 106 | -$541.95 | -2.04% | Unknown |
| 2025-01-03 | 2025-01-06 | 3 | $244.36 | $245.00 | 108 | $69.20 | 0.26% | Unknown |
| 2025-01-07 | 2025-01-08 | 1 | $241.92 | $242.70 | 109 | $85.24 | 0.32% | Unknown |
| 2025-01-10 | 2025-01-13 | 3 | $233.65 | $234.40 | 113 | $84.93 | 0.32% | SMA_Breakdown |
| 2025-01-14 | 2025-01-15 | 1 | $234.73 | $237.87 | 112 | $354.24 | 1.34% | SMA_Breakdown |
| 2025-01-16 | 2025-01-17 | 1 | $232.12 | $229.98 | 114 | -$244.95 | -0.92% | SMA_Breakdown |
| 2025-01-21 | 2025-01-22 | 1 | $219.75 | $223.83 | 120 | $492.17 | 1.86% | SMA_Breakdown |
| 2025-01-23 | 2025-01-24 | 1 | $224.78 | $222.78 | 118 | -$236.95 | -0.89% | SMA_Breakdown |
| 2025-01-27 | 2025-01-28 | 1 | $230.84 | $238.26 | 115 | $854.12 | 3.21% | SMA_Breakdown |
| 2025-01-29 | 2025-01-30 | 1 | $238.67 | $237.59 | 112 | -$121.21 | -0.45% | SMA_Breakdown |
| 2025-01-31 | 2025-02-03 | 3 | $229.99 | $228.01 | 116 | -$230.34 | -0.86% | SMA_Breakdown |
| 2025-02-04 | 2025-02-05 | 1 | $228.53 | $232.47 | 116 | $460.29 | 1.72% | SMA_Breakdown |
| 2025-02-06 | 2025-02-07 | 1 | $232.54 | $227.63 | 115 | -$566.14 | -2.11% | SMA_Breakdown |
| 2025-02-10 | 2025-02-11 | 1 | $228.20 | $232.62 | 116 | $516.59 | 1.94% | SMA_Breakdown |
| 2025-02-12 | 2025-02-13 | 1 | $236.91 | $241.53 | 113 | $522.64 | 1.95% | Unknown |
| 2025-02-19 | 2025-02-20 | 1 | $244.94 | $245.83 | 109 | $97.86 | 0.36% | Unknown |
| 2025-02-21 | 2025-02-24 | 3 | $245.00 | $247.10 | 110 | $231.05 | 0.86% | Unknown |
| 2025-02-25 | 2025-02-26 | 1 | $244.38 | $240.36 | 110 | -$444.36 | -1.64% | SMA_Breakdown |
| 2025-02-27 | 2025-02-28 | 1 | $236.98 | $241.84 | 113 | $551.71 | 2.05% | Unknown |
| 2025-03-03 | 2025-03-04 | 1 | $237.71 | $235.93 | 113 | -$202.48 | -0.75% | SMA_Breakdown |
| 2025-03-05 | 2025-03-06 | 1 | $234.44 | $235.33 | 115 | $102.46 | 0.38% | SMA_Breakdown |
| 2025-03-07 | 2025-03-10 | 3 | $235.54 | $227.48 | 114 | -$924.44 | -3.42% | SMA_Breakdown |
| 2025-03-11 | 2025-03-12 | 1 | $220.14 | $216.98 | 121 | -$384.47 | -1.44% | SMA_Breakdown |
| 2025-03-13 | 2025-03-14 | 1 | $211.25 | $213.49 | 126 | $282.99 | 1.06% | SMA_Breakdown |
| 2025-03-17 | 2025-03-18 | 1 | $214.15 | $212.69 | 124 | -$182.43 | -0.68% | SMA_Breakdown |
| 2025-03-19 | 2025-03-20 | 1 | $213.92 | $214.10 | 124 | $22.48 | 0.08% | SMA_Breakdown |
| 2025-03-21 | 2025-03-24 | 3 | $221.00 | $220.73 | 120 | -$32.64 | -0.12% | SMA_Breakdown |
| 2025-03-25 | 2025-03-26 | 1 | $223.51 | $221.53 | 119 | -$236.62 | -0.89% | SMA_Breakdown |
| 2025-03-27 | 2025-03-28 | 1 | $221.73 | $217.90 | 120 | -$460.36 | -1.73% | SMA_Breakdown |
| 2025-03-31 | 2025-04-01 | 1 | $219.87 | $223.19 | 120 | $400.69 | 1.51% | SMA_Breakdown |
| 2025-04-02 | 2025-04-03 | 1 | $205.53 | $203.19 | 129 | -$303.26 | -1.14% | SMA_Breakdown |
| 2025-04-04 | 2025-04-07 | 3 | $177.21 | $181.46 | 149 | $637.00 | 2.40% | SMA_Breakdown |
| 2025-04-08 | 2025-04-09 | 1 | $172.06 | $198.85 | 155 | $4160.32 | 15.57% | SMA_Breakdown |
| 2025-04-10 | 2025-04-11 | 1 | $186.10 | $198.15 | 149 | $1797.46 | 6.48% | SMA_Breakdown |
| 2025-04-14 | 2025-04-15 | 1 | $201.76 | $202.14 | 139 | $53.13 | 0.19% | SMA_Breakdown |
| 2025-04-16 | 2025-04-17 | 1 | $197.02 | $196.98 | 143 | -$5.73 | -0.02% | SMA_Breakdown |
The blotter analysis shows a mix of high-profit and high-loss trades. What stands out is that our largest profits often occurred during strong bounce-back days from oversold conditions, while the largest losses were typically related to unexpected trend reversals.
The weekly ledger shows the progression of the portfolio on a weekly basis, including cash/equity split, drawdowns, and returns.
| Date | Account() | | Total() | Cash | Equity($) | Drawdown(%) | Return(%) | |
|---|---|---|---|---|---|---|
| 2023-04-23 | 100000.00 | 100000.00 | 0.00 | 0.00 | 0.00 | |
| 2023-04-30 | 100000.00 | 100000.00 | 0.00 | 0.00 | 0.00 | |
| 2023-05-07 | 100000.00 | 100000.00 | 0.00 | 0.00 | 0.00 | |
| 2023-05-14 | 100000.00 | 100000.00 | 0.00 | 0.00 | 0.00 | |
| 2023-05-21 | 100007.63 | 100007.63 | 0.00 | 0.00 | 0.01 | |
| 2023-05-28 | 99851.76 | 74888.82 | 24962.94 | -0.16 | -0.15 | |
| 2023-06-04 | 100231.38 | 75173.53 | 25057.84 | 0.00 | 0.23 | |
| 2023-06-11 | 99649.28 | 99649.28 | 0.00 | -0.58 | -0.35 | |
| 2023-06-18 | 99995.23 | 74996.42 | 24998.81 | -0.24 | 0.00 | |
| 2023-06-25 | 100520.46 | 75390.35 | 25130.12 | 0.00 | 0.52 | |
| 2023-07-02 | 100792.17 | 100792.17 | 0.00 | 0.00 | 0.79 | |
| 2023-07-09 | 100665.84 | 100665.84 | 0.00 | -0.13 | 0.67 | |
| 2023-07-16 | 100527.43 | 75395.57 | 25131.86 | -0.26 | 0.53 | |
| 2023-07-23 | 100780.99 | 100780.99 | 0.00 | -0.01 | 0.78 | |
| 2023-07-30 | 100447.15 | 75335.36 | 25111.79 | -0.34 | 0.45 | |
| 2023-08-06 | 99699.85 | 99699.85 | 0.00 | -1.08 | -0.30 | |
| 2023-08-13 | 99505.37 | 74629.03 | 24876.34 | -1.28 | -0.49 | |
| 2023-08-20 | 99958.49 | 99958.49 | 0.00 | -0.83 | -0.04 | |
| 2023-08-27 | 99380.86 | 74535.65 | 24845.22 | -1.40 | -0.62 | |
| 2023-09-03 | 99762.04 | 99762.04 | 0.00 | -1.02 | -0.24 | |
| 2023-09-10 | 100099.44 | 75074.58 | 25024.86 | -0.69 | 0.10 | |
| 2023-09-17 | 99477.27 | 99477.27 | 0.00 | -1.30 | -0.52 | |
| 2023-09-24 | 99605.88 | 74704.41 | 24901.47 | -1.18 | -0.39 | |
| 2023-10-01 | 99440.65 | 99440.65 | 0.00 | -1.34 | -0.56 | |
| 2023-10-08 | 99623.96 | 74717.97 | 24905.99 | -1.16 | -0.38 | |
| 2023-10-15 | 99799.12 | 99799.12 | 0.00 | -0.99 | -0.20 | |
| 2023-10-22 | 99790.30 | 74842.73 | 24947.58 | -0.99 | -0.21 | |
| 2023-10-29 | 100178.00 | 100178.00 | 0.00 | -0.61 | 0.18 | |
| 2023-11-05 | 100693.09 | 75519.82 | 25173.27 | -0.10 | 0.69 | |
| 2023-11-12 | 101503.33 | 101503.33 | 0.00 | 0.00 | 1.50 | |
| 2023-11-19 | 101469.53 | 101469.53 | 0.00 | -0.03 | 1.47 | |
| 2023-11-26 | 101469.53 | 76102.15 | 25367.38 | -0.03 | 1.47 | |
| 2023-12-03 | 101369.93 | 101369.93 | 0.00 | -0.13 | 1.37 | |
| 2023-12-10 | 101881.73 | 76411.30 | 25470.43 | 0.00 | 1.88 | |
| 2023-12-17 | 102257.64 | 102257.64 | 0.00 | 0.00 | 2.26 | |
| 2023-12-24 | 102171.41 | 76628.56 | 25542.85 | -0.08 | 2.17 | |
| 2023-12-31 | 102030.46 | 76522.85 | 25507.62 | -0.22 | 2.03 | |
| 2024-01-07 | 101785.62 | 76339.22 | 25446.41 | -0.46 | 1.79 | |
| 2024-01-14 | 102504.86 | 102504.86 | 0.00 | 0.00 | 2.50 | |
| 2024-01-21 | 102988.45 | 102988.45 | 0.00 | 0.00 | 2.99 | |
| 2024-01-28 | 102872.38 | 77154.28 | 25718.09 | -0.11 | 2.87 | |
| 2024-02-04 | 103311.42 | 103311.42 | 0.00 | 0.00 | 3.31 | |
| 2024-02-11 | 103502.13 | 77626.60 | 25875.53 | 0.00 | 3.50 | |
| 2024-02-18 | 103005.83 | 103005.83 | 0.00 | -0.48 | 3.01 | |
| 2024-02-25 | 102712.86 | 102712.86 | 0.00 | -0.76 | 2.71 | |
| 2024-03-03 | 102858.82 | 77144.12 | 25714.71 | -0.62 | 2.86 | |
| 2024-03-10 | 102673.51 | 102673.51 | 0.00 | -0.80 | 2.67 | |
| 2024-03-17 | 102692.80 | 77019.60 | 25673.20 | -0.78 | 2.69 | |
| 2024-03-24 | 102940.51 | 102940.51 | 0.00 | -0.54 | 2.94 | |
| 2024-03-31 | 102859.13 | 102859.13 | 0.00 | -0.62 | 2.86 | |
| 2024-04-07 | 102594.75 | 76946.06 | 25648.69 | -0.88 | 2.59 | |
| 2024-04-14 | 102688.14 | 102688.14 | 0.00 | -0.79 | 2.69 | |
| 2024-04-21 | 102177.11 | 76632.83 | 25544.28 | -1.28 | 2.18 | |
| 2024-04-28 | 102519.26 | 102519.26 | 0.00 | -0.95 | 2.52 | |
| 2024-05-05 | 102183.38 | 102183.38 | 0.00 | -1.27 | 2.18 | |
| 2024-05-12 | 102183.38 | 102183.38 | 0.00 | -1.27 | 2.18 | |
| 2024-05-19 | 102183.38 | 102183.38 | 0.00 | -1.27 | 2.18 | |
| 2024-05-26 | 101634.95 | 76226.21 | 25408.74 | -1.80 | 1.63 | |
| 2024-06-02 | 101501.07 | 76125.80 | 25375.27 | -1.93 | 1.50 | |
| 2024-06-09 | 101983.64 | 101983.64 | 0.00 | -1.47 | 1.98 | |
| 2024-06-16 | 103755.41 | 103755.41 | 0.00 | 0.00 | 3.76 | |
| 2024-06-23 | 103755.41 | 77816.56 | 25938.85 | 0.00 | 3.76 | |
| 2024-06-30 | 103405.77 | 103405.77 | 0.00 | -0.34 | 3.41 | |
| 2024-07-07 | 103898.52 | 103898.52 | 0.00 | 0.00 | 3.90 | |
| 2024-07-14 | 104082.33 | 104082.33 | 0.00 | 0.00 | 4.08 | |
| 2024-07-21 | 103408.47 | 77556.35 | 25852.12 | -0.65 | 3.41 | |
| 2024-07-28 | 102343.13 | 102343.13 | 0.00 | -1.67 | 2.34 | |
| 2024-08-04 | 101611.41 | 76208.56 | 25402.85 | -2.37 | 1.61 | |
| 2024-08-11 | 103772.30 | 103772.30 | 0.00 | -0.30 | 3.77 | |
| 2024-08-18 | 104060.68 | 78045.51 | 26015.17 | -0.02 | 4.06 | |
| 2024-08-25 | 104194.40 | 104194.40 | 0.00 | 0.00 | 4.19 | |
| 2024-09-01 | 104393.20 | 78294.90 | 26098.30 | 0.00 | 4.39 | |
| 2024-09-08 | 103809.20 | 77856.90 | 25952.30 | -0.56 | 3.81 | |
| 2024-09-15 | 103826.70 | 103826.70 | 0.00 | -0.54 | 3.83 | |
| 2024-09-22 | 104398.81 | 78299.11 | 26099.70 | 0.00 | 4.40 | |
| 2024-09-29 | 104377.67 | 104377.67 | 0.00 | -0.02 | 4.38 | |
| 2024-10-06 | 104062.56 | 78046.92 | 26015.64 | -0.32 | 4.06 | |
| 2024-10-13 | 104004.70 | 104004.70 | 0.00 | -0.38 | 4.00 | |
| 2024-10-20 | 103889.92 | 77917.44 | 25972.48 | -0.49 | 3.89 | |
| 2024-10-27 | 103923.10 | 103923.10 | 0.00 | -0.46 | 3.92 | |
| 2024-11-03 | 103561.06 | 77670.80 | 25890.27 | -0.80 | 3.56 | |
| 2024-11-10 | 103679.96 | 103679.96 | 0.00 | -0.69 | 3.68 | |
| 2024-11-17 | 104014.88 | 78011.16 | 26003.72 | -0.37 | 4.01 | |
| 2024-11-24 | 104635.62 | 104635.62 | 0.00 | 0.00 | 4.64 | |
| 2024-12-01 | 105105.18 | 105105.18 | 0.00 | 0.00 | 5.11 | |
| 2024-12-08 | 105407.66 | 105407.66 | 0.00 | 0.00 | 5.41 | |
| 2024-12-15 | 105521.87 | 79141.40 | 26380.47 | 0.00 | 5.52 | |
| 2024-12-22 | 106091.15 | 79568.36 | 26522.79 | 0.00 | 6.09 | |
| 2024-12-29 | 106228.51 | 79671.38 | 26557.13 | 0.00 | 6.23 | |
| 2025-01-05 | 105684.45 | 79263.34 | 26421.11 | -0.51 | 5.68 | |
| 2025-01-12 | 105838.90 | 79379.17 | 26459.72 | -0.37 | 5.84 | |
| 2025-01-19 | 106033.11 | 106033.11 | 0.00 | -0.18 | 6.03 | |
| 2025-01-26 | 106288.33 | 106288.33 | 0.00 | 0.00 | 6.29 | |
| 2025-02-02 | 107021.24 | 80265.93 | 26755.31 | 0.00 | 7.02 | |
| 2025-02-09 | 106685.04 | 106685.04 | 0.00 | -0.31 | 6.69 | |
| 2025-02-16 | 107724.27 | 107724.27 | 0.00 | 0.00 | 7.72 | |
| 2025-02-23 | 107822.13 | 80866.60 | 26955.53 | 0.00 | 7.82 | |
| 2025-03-02 | 108160.53 | 108160.53 | 0.00 | 0.00 | 8.16 | |
| 2025-03-09 | 108060.51 | 81045.38 | 27015.13 | -0.09 | 8.06 | |
| 2025-03-16 | 107034.58 | 107034.58 | 0.00 | -1.04 | 7.03 | |
| 2025-03-23 | 106874.63 | 80155.97 | 26718.66 | -1.19 | 6.87 | |
| 2025-03-30 | 106145.01 | 106145.01 | 0.00 | -1.86 | 6.15 | |
| 2025-04-06 | 106242.44 | 79681.83 | 26560.61 | -1.77 | 6.24 | |
| 2025-04-13 | 112837.23 | 112837.23 | 0.00 | 0.00 | 12.84 | |
| 2025-04-20 | 112884.63 | 112884.63 | 0.00 | 0.00 | 12.88 |
The ledger shows that our strategy maintained consistent growth with modest drawdowns. The portfolio experienced its maximum drawdown of -2.37% in July 2024, but recovered strongly. The most significant growth period occurred in April 2025, where several highly profitable trades (shown in the blotter) contributed to a sharp increase in account value.
Conclusions & Future Work
The “Buy Low Sell High” strategy using RSI=35 as the entry signal produced a solid positive return of 12.88% over the 24-month testing period, significantly outperforming our previous configuration. The strategy demonstrated excellent risk management with a maximum drawdown of only 2.37%.
Our analysis of exit reasons revealed that RSI Overbought exits were the most profitable, yielding an average profit of $295.84 per trade compared to $64.34 for SMA Breakdown exits. This suggests that allowing trades to run until overbought conditions occur may be more profitable than exiting based on moving average breakdowns.
Strategy Strengths:
- Strong positive return (12.88%)
- Good win rate (55.41%)
- Excellent risk-adjusted performance (Sharpe 0.95)
- Low drawdown (2.37%)
- Ability to capture significant price rebounds
- Clear entry and exit rules
- RSI Overbought exits yield highest profits